Supply and Demand
Supply and demand model
- a model of how a competitive market functions
The demand curve
The supply curve
The determinants of demand and supply
The equilibrium price and quantity
Demand Schedule and Demand Curve
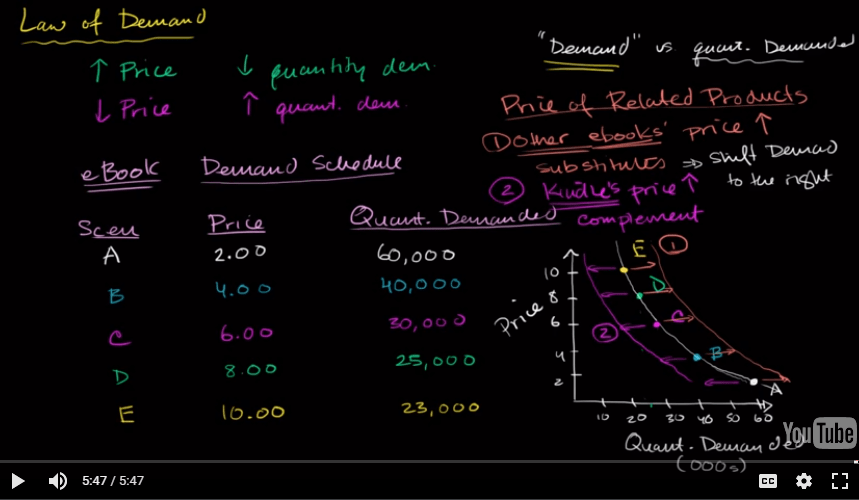
The law of demand
A higher price leads to a lower quantity demaned
A lower price leads to a higher quantity demanded
Demand schedule vs. demand curve
A demand schedule is a table that shows the quantity demanded at each price.
A demand curve is a graph that shows the quantity demanded at each price
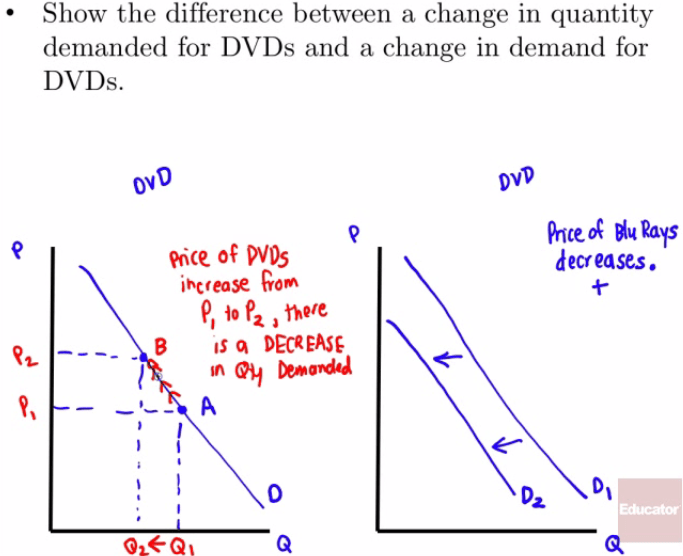
Demand vs. quantity demanded
| demand | the relationship between a range of prices and the quantities demanded at those prices, as illustrated by a demand curve or a demand schedule. |
|---|---|
| quantity demanded | only a certain point on the demand curve or one quantity on the demand schedule |
Demand refers to the curve, and quantity demanded refers to a specific point on the curve.
If price increases, what happens?
No change in demand
Decrease in quantity demanded
Graphical Comparison
Demand curve
Horizontal axis: Quantity Demanded
Vertical axis: Price
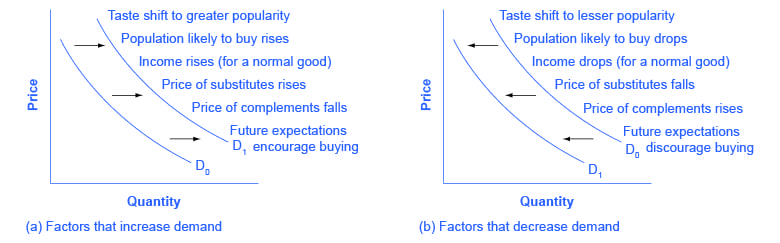
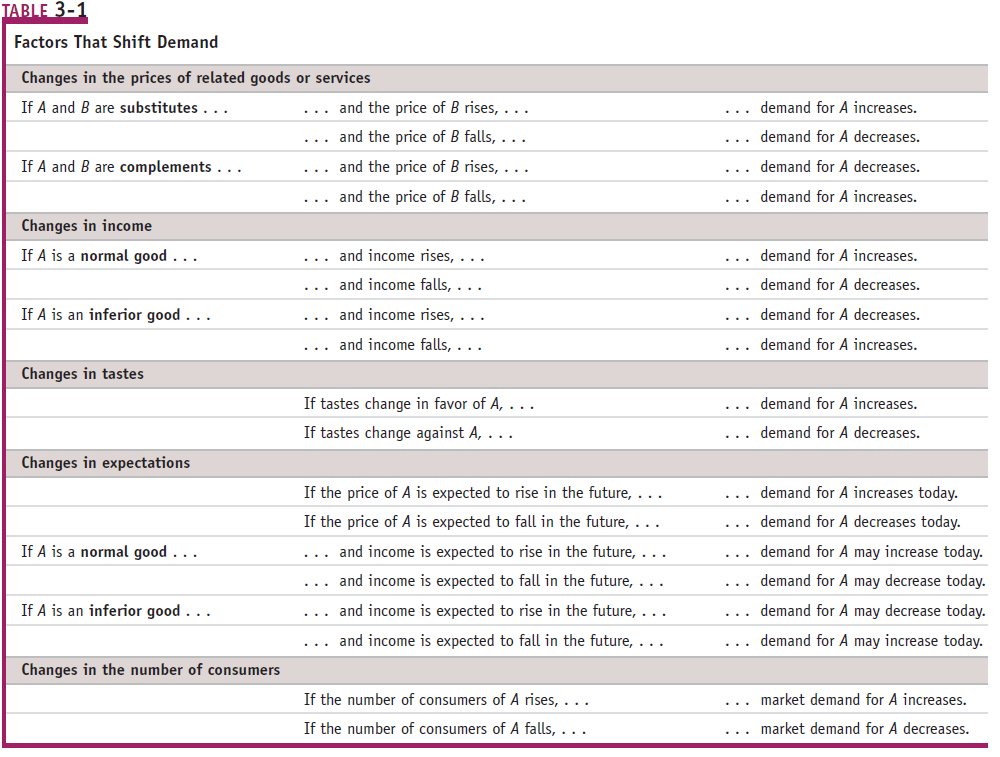
Shift of the Demand Curve
Changes in the price of related goods
Substitutes (positive correlation)
- fall in the price of one goods makes consumers less willing to buy the other good
Complements (negative correlation)
- fall in the price of one of the goods makes consumers more willing to buy the other good
How to remember
Kids are positive when having a substitute teacher
We lived in a cynical world. If someone gives you a complement, the true intention might be negative.
Changes in income
Normal goods
rise in income increases demand
ie. computers, Disneyland, steak
Inferior goods
rise in income decreases demand
ie. macaroni & cheese, top ramen
Normal goods vs. inferior goods
Changes in tastes
Why do people want what they want?
Changes due to fad, beliefs, cultural shifts are all clumped together under preferences.
Changes in expectations
If you expect more income in the future, demand for certain goods (ie. car or refrigerator) might increase
If expectation of a future price drop of items exist, then the demand for these items drop today, almost like a self-fulfilling prophecy.
Graph
Summary
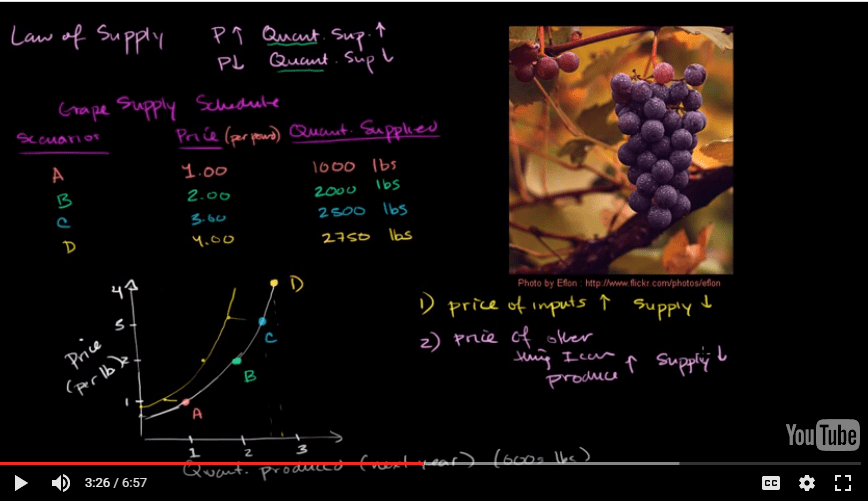
Supply Schedule and Supply Curve
The law of supply
A higher price leads to a higher quantity supplied.
A lower price leads to a lower quantity supplied.
Supply schedule vs. supply curve
A supply schedule is a table that shows the quantity supplied at each price.
A supply curve is a graph that shows the quantity supplied at each price.
Supply vs. quantity supplied
| supply | the relationship between a range of prices and the quantities supplied at those prices, as illustrated by a supply curve or a supply schedule. |
|---|---|
| quantity supplied | only a certain point on the supply curve or one quantity on the supply schedule |
Supply refers to the curve, and quantity supplied refers to a specific point on the curve.
If price increase, what happens to supply?
Nothing
This is a change in quantity supplied not supply
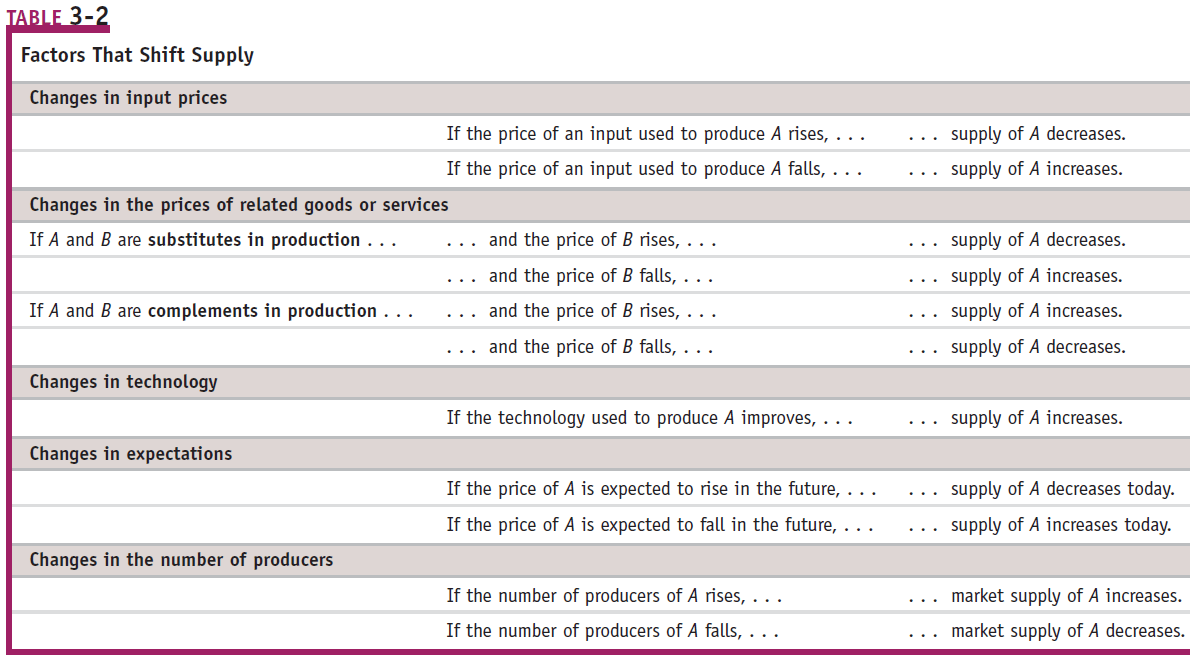
Shifts of the Supply Curve
Changes in input prices
Input is a good used to produce another good
ie. cheese in a cheese pizza
Change in technology
All the ways in which people can turn more inputs into useful goods
For example, an improved strain of corn resistant to disease increase supply of corn.
Change in expectations
- If expectations of a future price increase of items exist, then supplier will tend to hoard the item in order to make more profit in the future.
Related goods
- If the price of other things I can produce goes up, then my supply of grapes, once again, would go down.
Graph
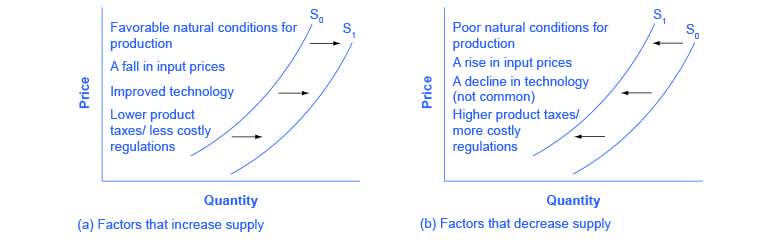
Summary
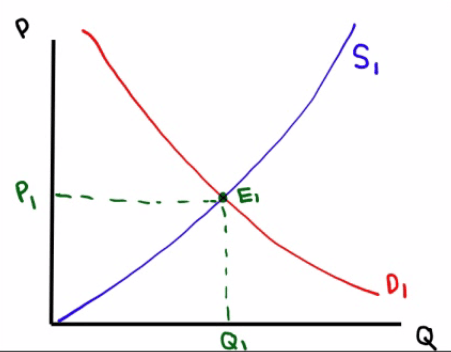
Supply, Demand, and Equilibrium
Equilibrium price
- price that clears the market
Equilibrium quantity
- quantity of good bought and sold at market-clearing price
Equilibrium
- where the supply and demand curves intersect
Graph
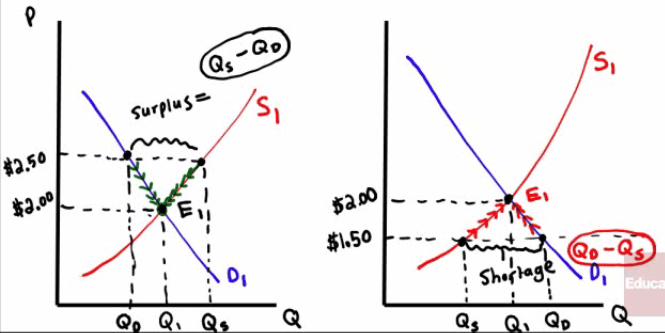
Surplus & Shortage
Surplus
when quantity supplied exceeds quantity demanded


Shortage
when quantity demanded exceeds quantity supplied


Graph