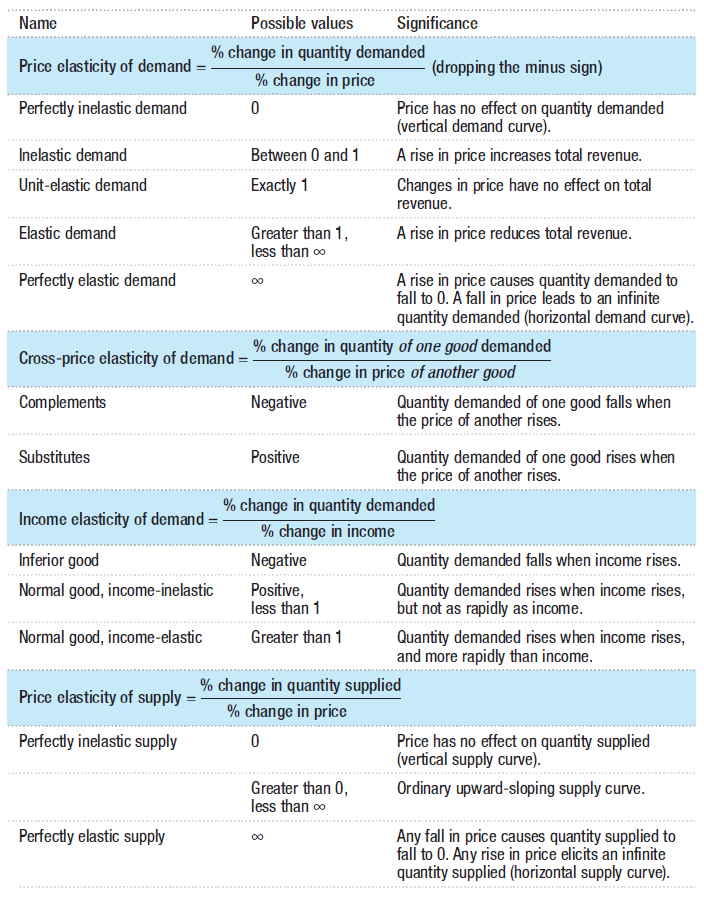
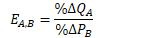
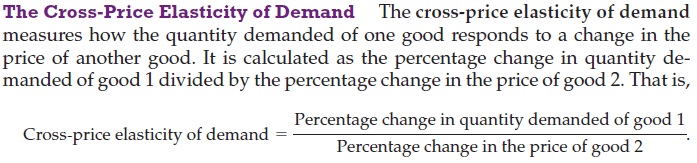
Cross-price elasticity of demand (EA,B)

  • Meaning

    • Measure used to show the change in the price of one good affecs the demand for another good.
  • Formula

    • Percentage change in Quantity Demanded of Good A divided by Percentage change in Price of Good B
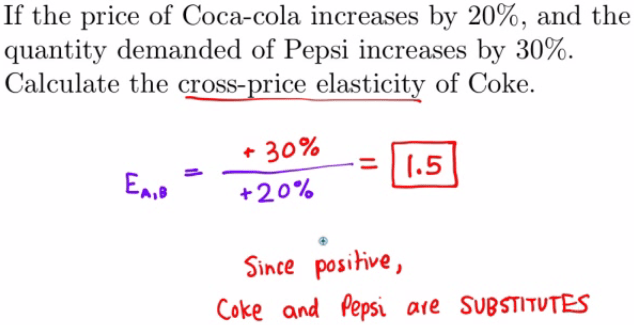
    • C:\\CE5A5F25\\EA5686BB-78FF-4844-9ADF-D3586C9ED368\_files\\image064.png

    The Cross-Price Elasticity of Demand The cross-price elasticity of
demand measures how the quantity demanded of one good responds to a
change in the price of another good. It is calculated as the
percentage change in quantity de- manded of good 1 divided by the
percentage change in the price of good 2. That is, Percentage change
in quantity demanded of good 1 Cross-price elasticity of demand =
Percentage change in the price of good 2

Substitutes

  • Definition

    • If the coefficient is positive, then the two items are substitutes.

    • *Do NOT find the absolute value for cross-price elasticity!

  • EA,B and substitutes

    • The higher the number, the more perfect the two items are as substitutes.

    • The lower the number, the less perfect the two items are as substitutes.

  • Price change and quantity demanded

    • If the price of Good A increases , then the quantity demanded of Good B will increase.

    • If the price of Good A decreases, then the quantity demanded of Good B will decrease.

  • Example

    If the price of Coca-cola increases by 20%, and the quantity
demanded of Pepsi increases by 30%. Calculate the cross-price
elasticity of Coke. Since posihve Coke ad Pepsi ate SUBSTITUTES

Complements

  • Definition

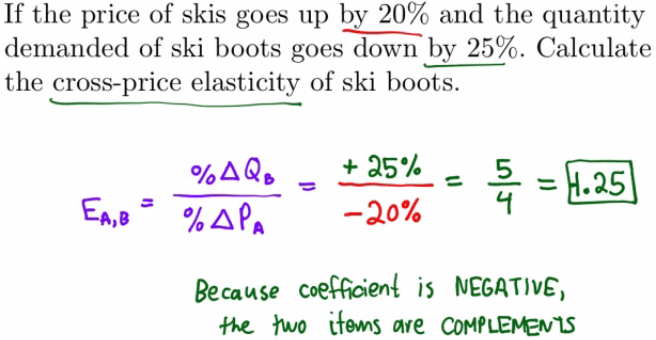
    • If the coefficient is negative, then the two items are complements.

    • *Do NOT find the absolute value for cross-price elasticity!

  • EA,B and substitutes

    • The more negative the number, the more perfect the two items are as complements.

    • The less negative the number, the less perfect the two items are as complements.

  • Price change and quantity demanded

    • If the price of Good A increases , then the quantity demanded of Good B will decrease.

    • If the price of Good A decreases, then the quantity demanded of Good B will increase.

  • Example

    If the price of skis goes up by 20% and the quantity demanded of ski
boots goes down by 25%. Calculate the cross-price elasticity of ski
boots. 0/0 Q b 5 = .25 % APA Because is NEGATIVE) are Cot4PLEt..ew1S

Income Elasticity of Demand

  • Meaning

    • Measures how changes in income affect the demand for a good
  • Normal good vs. Inferior good

    • If the income elasticity of demand is positive, then it's a normal good.

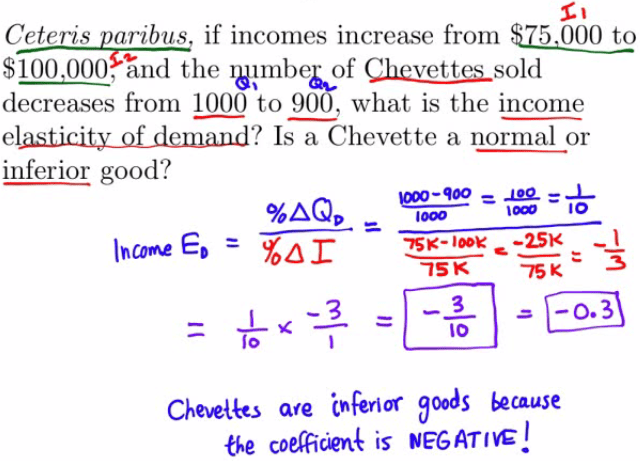
    • If the income elasticity of demand is negative, then it's a inferior good.

  • Income-elastic vs. income-inelastic

    • If the income elasticity of demand is greater than 1, then it is income-elastic

    • If the income elasticity of demand is less than 1, then it is income-inelastic
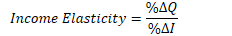
  • Formula

    • Percentage change in Quantity Demanded Divided by Percentage change in Income
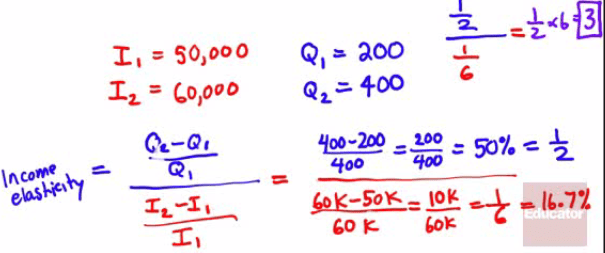
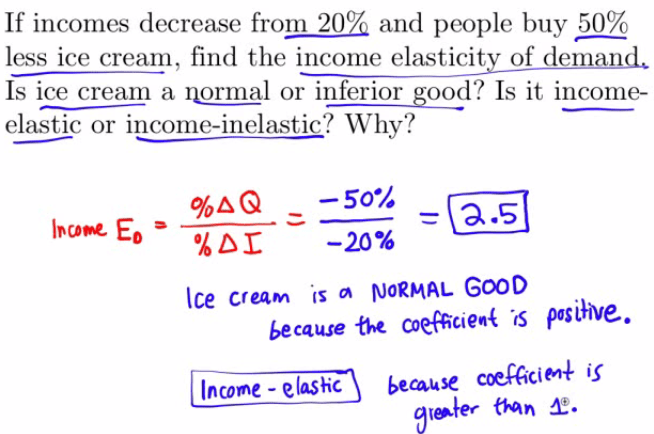
    • C:\\CE5A5F25\\EA5686BB-78FF-4844-9ADF-D3586C9ED368\_files\\image068.png

  • Example 1

    • Income elastic good:

    Machine generated alternative text: 工 . = 50 》 000 工 = CO 000 上 以 3
= 2 亠 , 00 , 凶 60B

  • Example 2

    • ceteris paribus: all other things being equal

    if incomes increase from $75,000 to $100 000? find the decreases
from 1000 to 900, what is the income elÅs.ticitx-Qf—demand? Is a
Chevette a normal or inferior good? æ-:ye - = -L %AQD 10 10 10
Chevelkes are inferior 300ås because the coeffic@nk is NEGATIE\!

  • Example 3

    If incomes decrease from 20% and people buy 50% less ice cream, find
the income elasticity of Is ice cream a normal or inferior good? Is it
income- elastic or income-inelastic? Why? —50% %A@ as -20% Ice cream
is NORMAL GOOD because coefGcien4 posthve. because

Price Elasticity of Supply

  • Meaning

    • Measure of responsiveness of the quantity of a good supplied to the price of that good
  • Formula

    • Percentage change in quantity supplied divided by the percentage change in price

    • C:\\CE5A5F25\\EA5686BB-78FF-4844-9ADF-D3586C9ED368\_files\\image072.png

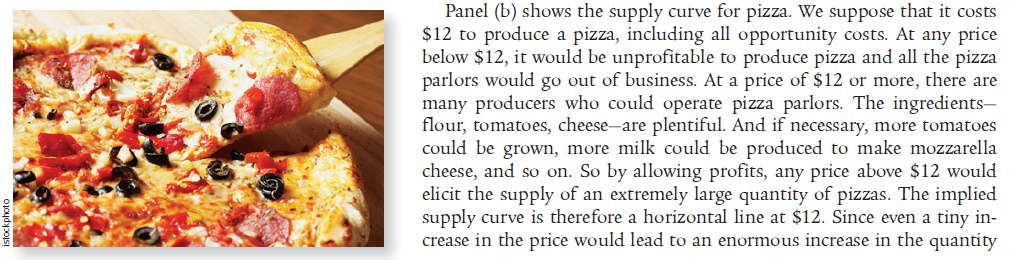
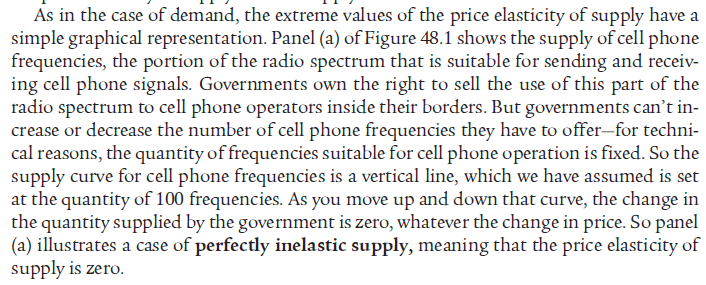
  • Availability of inputs affects elasticity

    • Supply of pizza tends to be very elastic

    Panel (b) shows the supply curve for pizza. We suppose that it costs
$12 to produce a pizza, including all opportunity costs. At any price
below $12, it would be unprofitable to produce pizza and all the pizza
parlors would go out of business. At a price of $12 or more, there are
many producers who could operate pizza parlors. The ingredients—
flour, tomatoes, cheese—are plentiful. And if necessary, more tomatoes
could be grown, more milk could be produced to make mozzarella cheese,
and so on. So by allowing profits, any price above $12 would elicit
the supply of an extremely large quantity of pizzas. The implied
supply curve is therefore a horizontal line at $12. Since even a tiny
in- crease in the price would lead to an enormous increase in the
quantity

  • Supply of cell phone frequencies is zero. The input (radio spectrum) cannot be changed
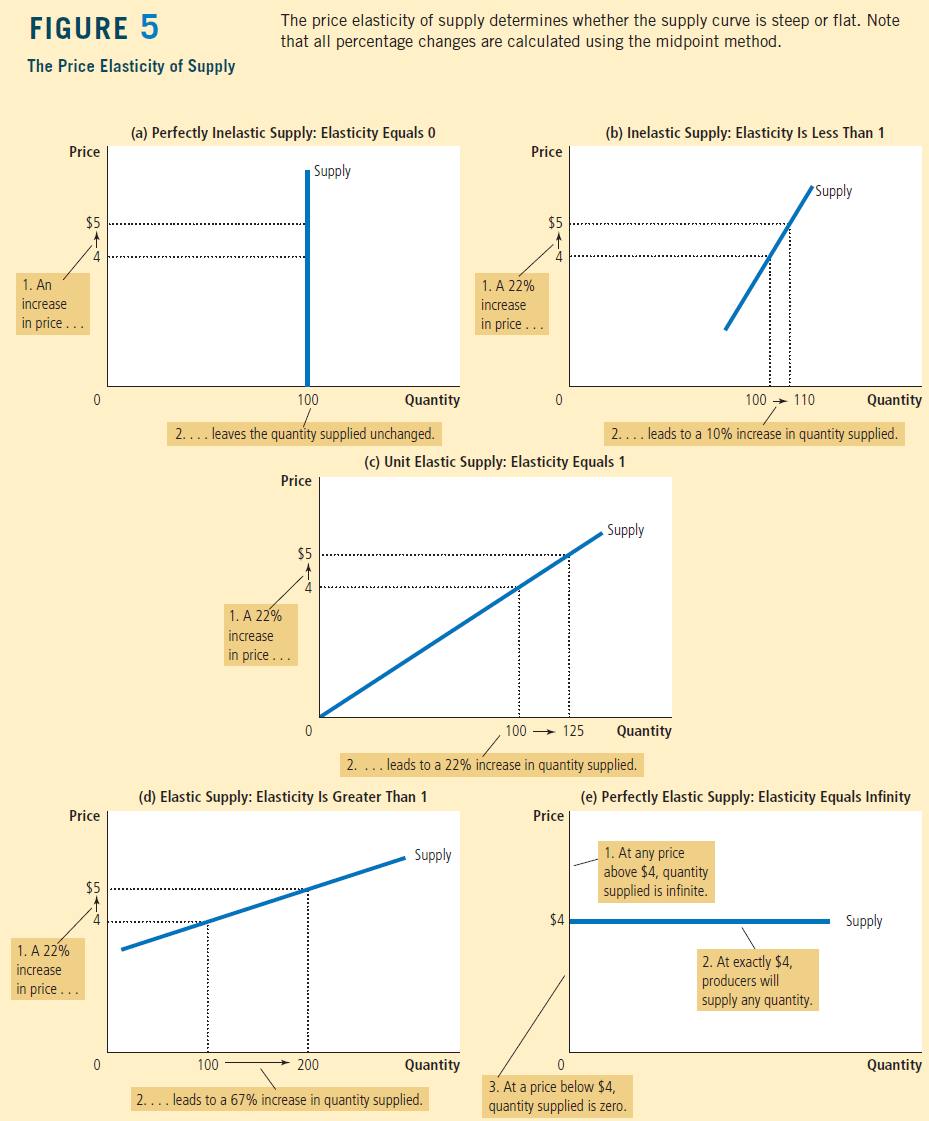
    As in the case of demand, the extreme values of the price elasticity
of supply have a simple graphical representation. Panel (a) of Figure
48.1 shows the supply ofcell phone frequencies, the portion of the
radio spectrum that is suitable for sending and receiv- ing cell phone
signals. Governments own the right to sell the use of this part of the
radio spectrum to cell phone operators inside their borders. But
governments can't in- crease or decrease the number of cell phone
frequencies they have to offer—for techni- cal reasons, the quantity
of frequencies suitable for cell phone operation is fixed. So the
supply curve for cell phone frequencies is a vertical line, which we
have assumed is set at the quantity of 100 frequencies. As you move up
and down that curve, the change in the quantity supplied by the
government is zero, whatever the change in price. So panel (a)
illustrates a case of perfectly inelastic supply, meaning that the
price elasticity of supply is zero.

  • Graph

Price $5 4 1. An Increase In price Price $5 4 Increase In pnce FIGURE
5 The price elasticity of supply determines whether the supply curve is
steep or flat. Note that all percentage changes are calculated using the
midpoint method. The Price Elasticity of Supply 2... IOO 125 (a)
Perfectly Inelastic Supply: Elasticity Equals O Supply Quantity . leaves
the quantity supplied unchanged. Price $5 4 Increase In price (b)
Inelastic Supply: Elasticity Is Less Than 1 Supply IOO 110 Quantity
2.... leads to a 10% increase in quantity supplied. Price 55 4 Increase
In price (c) Unit Elastic Supply: Elasticity Equals 1 Supply Quantity ..
leads to a 22% increase in quantity supplied. (d) Elastic Supply:
Elasticity Is Greater Than 1 Price 200 Supply Quantity (e) Perfectly
Elastic Supply: Elasticity Equals Infinity 1. At any price above 54,
quantiW supplied is infinite. Supply . At exactly $4, producers will
pply any quantity Quantity 2.... leads to a 67% increase in quantity
supplied. 3. Ata price below 54, quantity supplied is zero.

Summary for Elasticity

Namc Pricc clasticity of demand Perfectly inelastic demand Inelastic
  demand Unit-elastic demand Elastic demand Perfectly elastic demand
  Possiblc values Significance % change in quantity demanded (dropping
  thc minus sign) % change in price Betvveen 0 and 1 Exactly 1 Greater
  than 1 , less than Price has no effect on quantity demanded (vertical
  demand curve). A rise in price increases total revenue. Changes in
  price have no effect on total revenue. A rise in price redires total
  revenue. A rise in price causes quantity demanded to fall too. A fall
  in price leads to an infinite quantity demanded (horizontal demand
  curve). Cross-price clasticity of demand Complements Substitutes %
  change in quantib' of one good dcmandcd % change in price of another
  good Negative Positive Quantity demanded of one good falls when the
  price of another rises. Quantity demanded of one good rises when the
  price of another rises. Income elasticity of demand Inferior good
  Normal good, income-inelastic Normal good, income-elastic % change in
  quantib' dcmandcd % change in income Negative Positive, less than 1
  Greater than 1 Quantity demanded falls when income rises. Quantity
  demanded rises when income rises, but not as rapidly as income.
  Quantity demanded rises when income rises, and more rapidly than
  income. % change in quantib' supplied Pricc clasticity of supply
  Perfectly inelastic supply Perfectly elastic supply % change in price
  Greater than 0, less than Price has no effect on quantity supplied
  (vertical supply curve). Ordinary upward-sloping supply curve. Any
  fall in price causes quantity supplied to fall to 0. Any rise in price
  elicits an infinite quantity supplied (horizontal supply curve).

results matching ""

    No results matching ""