Characteristics of Monopoly
Meaning
- Monopolists is the only producer of a good with no close substitutes
Tens to have at least one of these four barriers to entry
Control of a scare resource of input
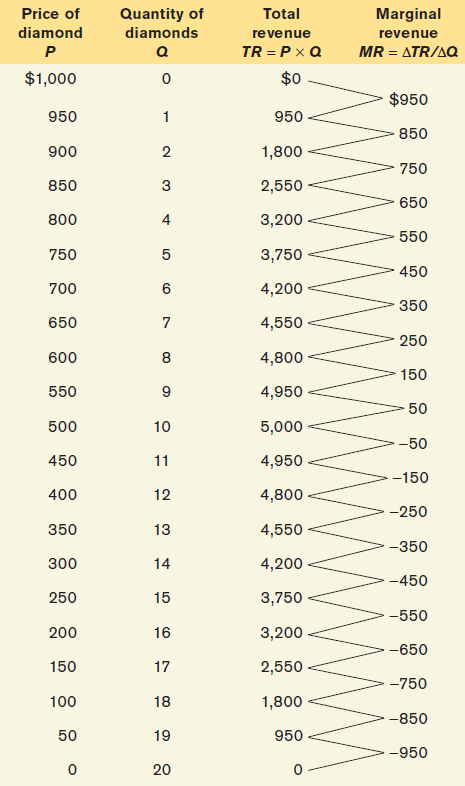
- Cecil Rhodes made De Beers what it is by controlling most of the world's diamond mines.
Economies of scale
- large firms tend to have cost advantages in markets characterized by economies of scale, or a natural monopoly
Technological superiority
- short-term advantage for companies although network externalities are very crucial as well
Government monopolies
patent (monopoly of invention)
copyright (monopoly of literary or artwork)
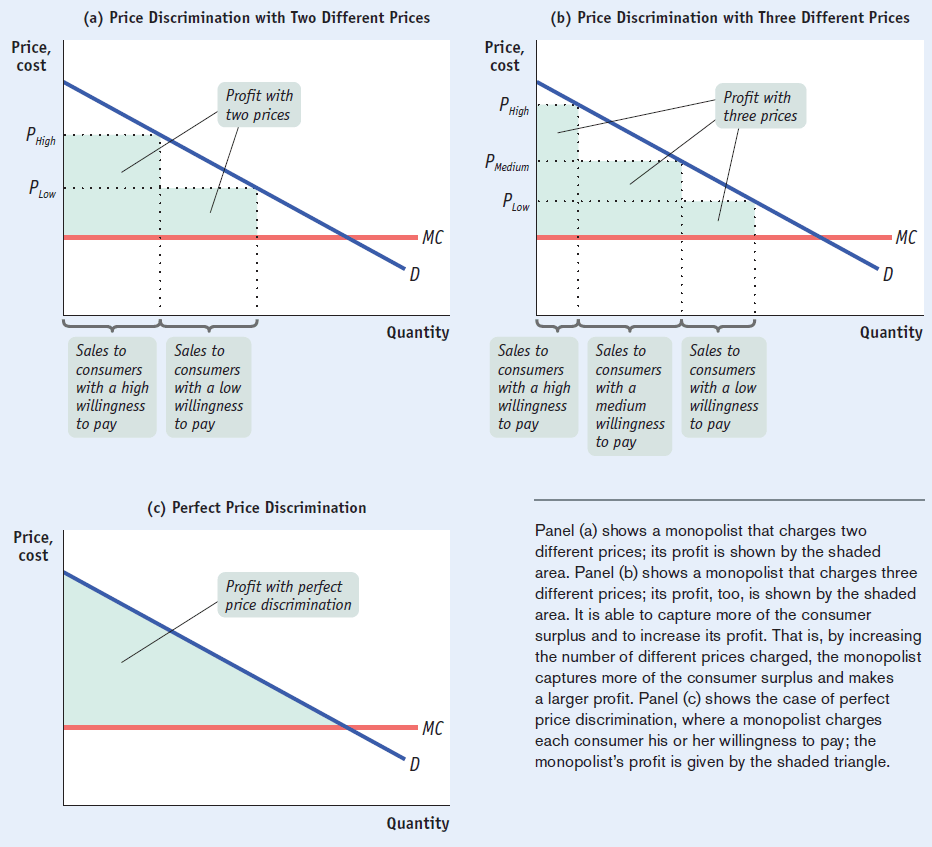
Monopoly and Price Discrimination
Price discrimination (3rd degree)
policy of charging different prices to different consumers for the same good
ie. movie tickets, rebates, airline flights
Perfect price discrimination (1st degree)
takes place when a monopolist charges each consumer his or her willingness to pay the maximum that the consumer is willing to pay
No consumer surplus
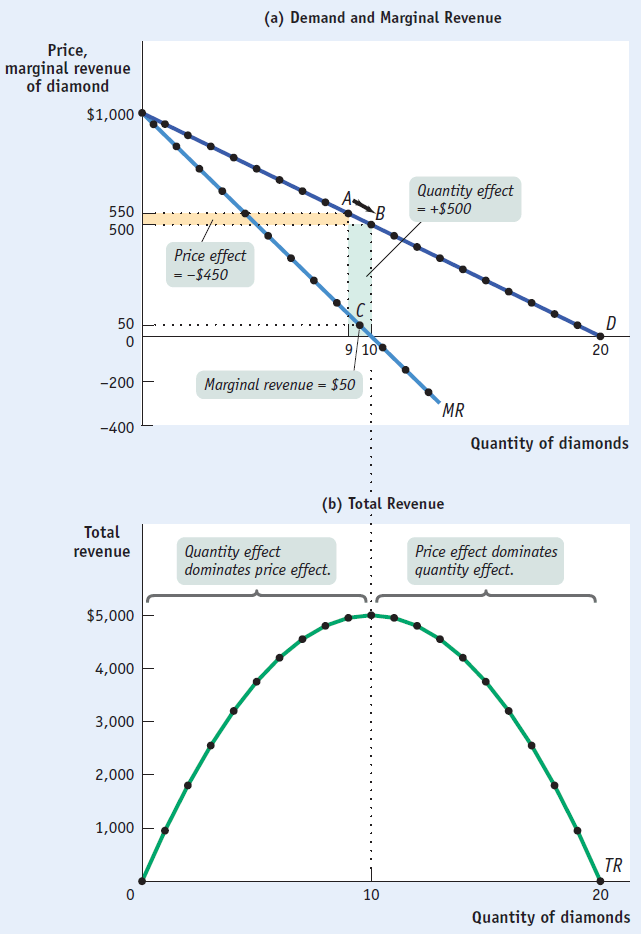
Decreasing Marginal Revenue
The increase in production by a monopolist has two opposing effects on revenue
Quantity effect
- One more unit is sold, increasing total revenue by the price at which the unit is sold
Price effect
- In order to sell the last unit, the monopolist must cut market price on all unites sold. This decreases total revenue
What is the relationship between Demand curve and MR curve in a monopoly?
MR curve is below the Demand curve and steeper than the Demand curve.
Because the price on all units sold must fall if the monopoly increases production
Example
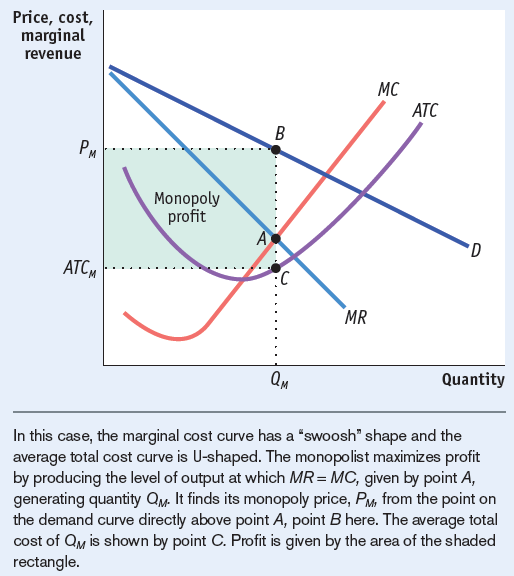
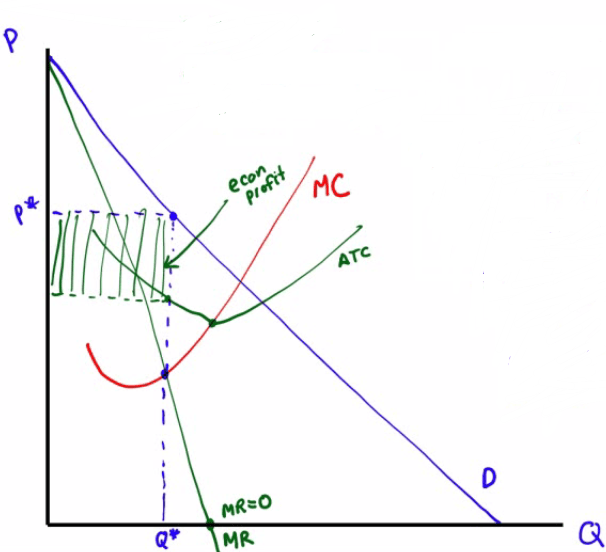
Monopoly and Profit
Profit = TR - TC = (P * Q) - (ATC * Q)
Monopoly Making a Profit
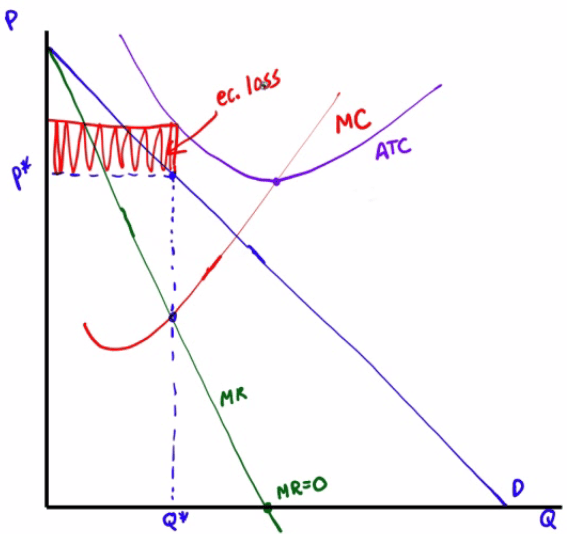
Monopoly Incurring a Loss
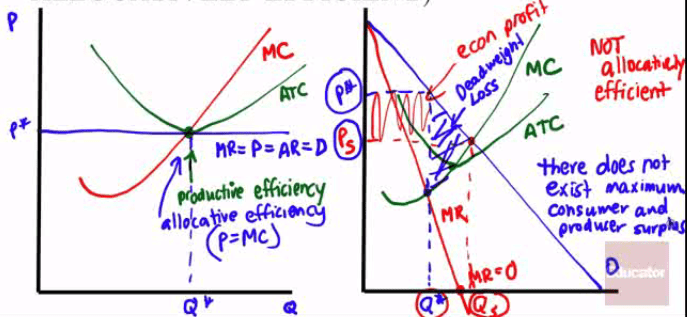
Monopoly vs. Perfect Competition
P = MR = MC at the perfectly competitive firm's profit-maximizing quantity of output
P > MR = MC at the monopolist's profit-maximizing quantity of output
Monopoly charges a higher price, produces a lower quantity and earns a profit
Not Allocatively Efficient
profit
deadweight loss
There does not exist maximum consumer and producer surplus
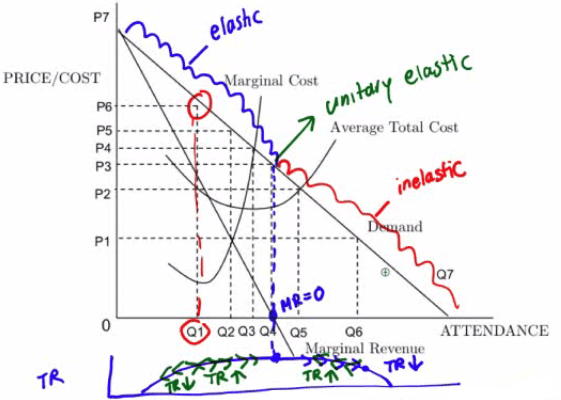
Reading a Monopoly Graph
There is one stadium in Parkville. The stadium's demand and cost curves are shown below. The stadium currently relies on an admission charge for its revenue.
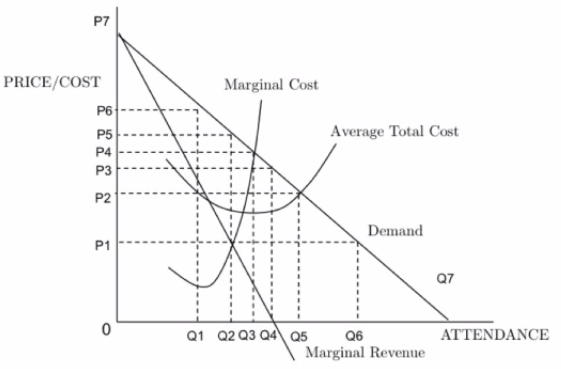
Using the labeling of the graph above, identify the price and quantity that maximize profit
Price: P5
Quantity: Q2
Using the labeling of the graph above, identify the price and quantity that maximized total revenue
When MR intersects the x-axis
Price: P3
Quantity: Q4
Using the labeling of the graph above, identify the price and quantity that maximizes attendance while still breaking even
When demand curve intersects ATC curve
Price: P2
Quantity: Q5
Assuming the existence of an opportunity cost, at P2, indicate whether stadium's accounting profits would be positive, negative, or zero. Explain why.
Economic Profit = Total Revenue - Total Cost = 0
Economic Profit = Accounting Profit - Opportunity Cost = 0
Accounting Profit = Opportunity Cost
Answer: positive
When the attendance is Q1, is the demand inelastic, elastic or unitary elastic? Explain
Answer: Elastic
Explanation: Marginal Cost is positive or the price is on the left side of the demand curve
A monopolist will always produce on the elastic portion of the demand curve